Problem Description
Airbnb is an online platform that connects people who want to rent out their properties with travelers seeking accommodations. As a popular platform for short-term rentals, Airbnb generates vast amounts of data every day related to property listings, host information, guest reviews, and pricing. This project aims at performing a comprehensive analysis of Airbnb data to gain insights into the rental market and understand factors that influence pricing and availability in different neighbourhoods and room types.
To stay competitive in this ever-growing market, Airbnb hosts need to set competitive prices based on factors such as location, property type, and the demand for accommodations in specific neighbourhoods. Understanding the relationship between these factors and pricing can help hosts optimize their listing strategies, attract more guests, and maximize their earnings.
The Airbnb Data Analysis project aims to provide valuable insights into the rental market by exploring and visualizing various aspects of the dataset. Through exploratory data analysis and geospatial visualization, this project will uncover patterns and trends related to property listings, pricing, and availability across different neighbourhoods and room types.
Additionally, by building regression models, the project will attempt to predict property prices based on specific features. The findings from this analysis can be useful for both Airbnb hosts and travelers, enabling hosts to optimize their listings and pricing strategies and helping travelers make informed decisions while booking accommodations.
Dataset
The dataset used in this project is the New York City Airbnb Open Data from Kaggle. The dataset contains information on 48,895 Airbnb listings in New York City. The dataset covers a period of 11 years, from 2008 to 2019. This is a public dataset and part of Airbnb. The original source of the data can be found on this website.
The dataset is provided in a CSV file format. It contains 16 columns:
- id:
- name:
- host_id
- hostname
- neighbourhood_group
- neighbourhood
- latitude
- longitude
- room_type
- price
- minimum_nights
- number_of_reviews
- last_review
- reviews_per_month
- calculated_host_listing_counts
- availability_365
Unique identifier for each listing
Name of the listing
Unique identifier for each host
Name of the host
The borough in which the listing is located
The specific neighbourhood in which the listing is located
Latitude of the listing’s geographical location
Longitude of the listing’s geographical location
The type of room being listed
Price per night of the listing
The minimum number of nights a guest is required to stay
Number of reviews that the listing has received
Date of the last review
Number of reviews per month
Number of listings that the host has
Number of days the listing is available for booking in the next 365 days
Tasks
- Data Preprocessing:
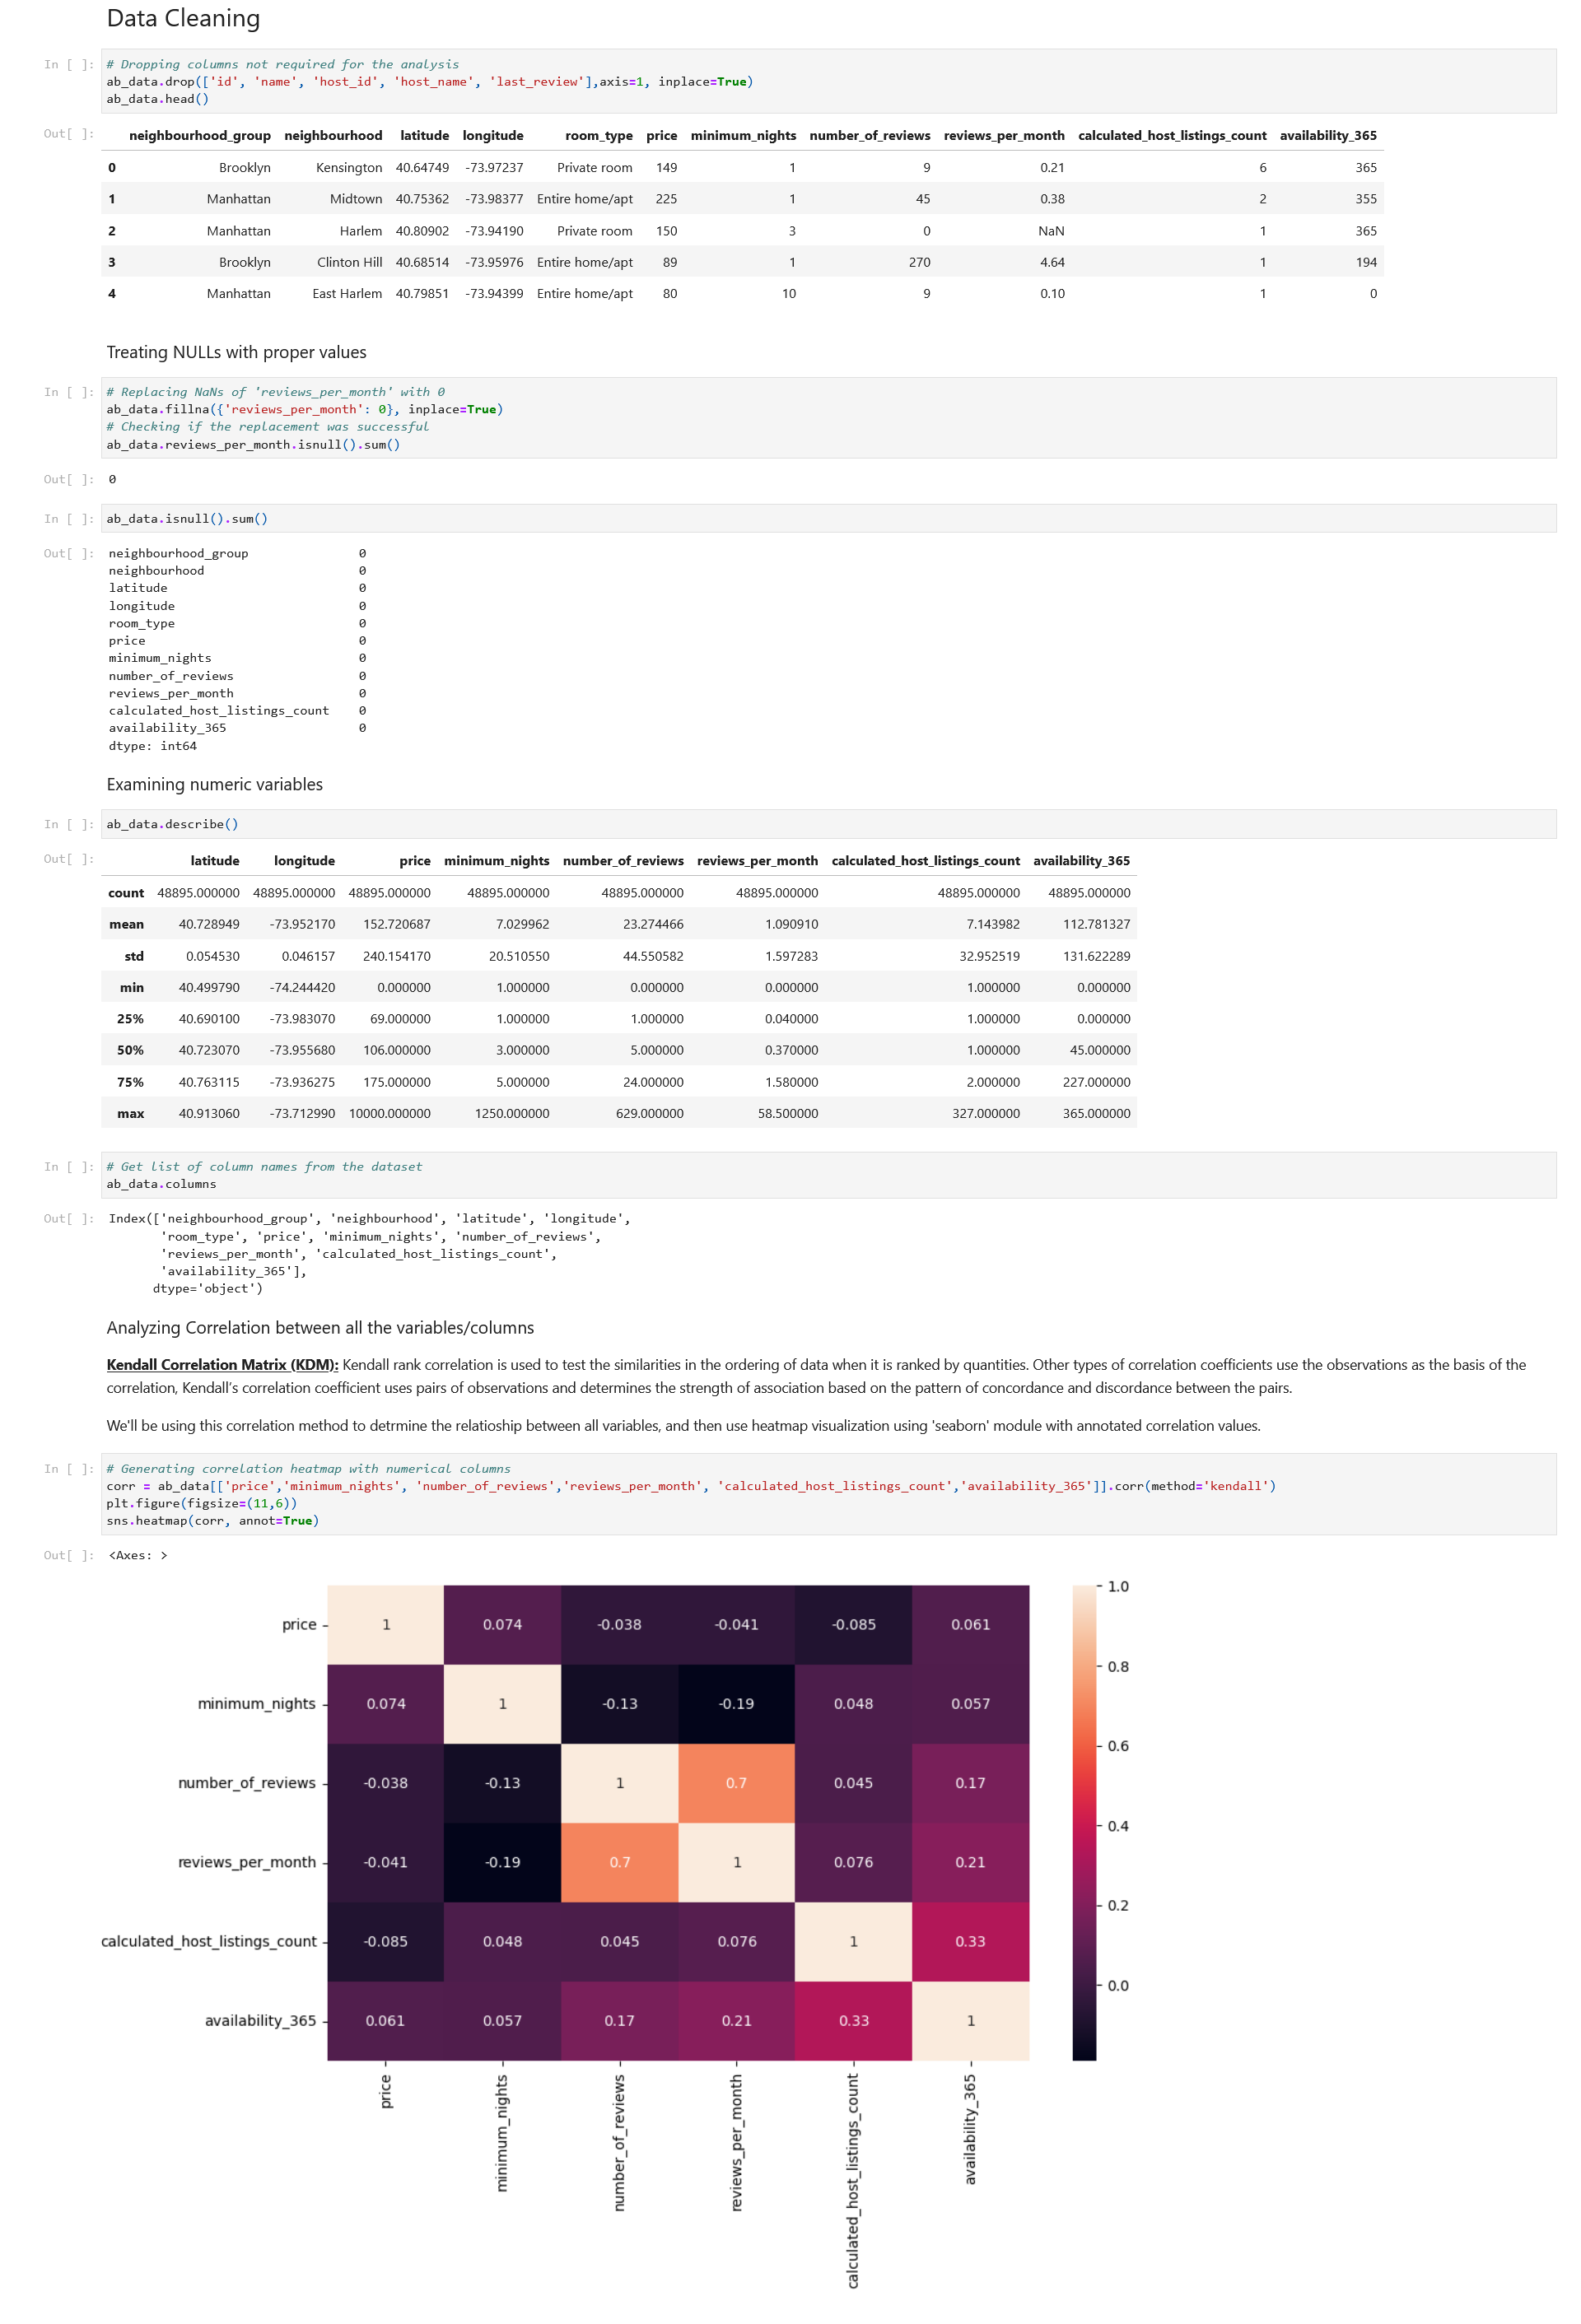
- Understand the overall data, shape, and its structure. Handle any duplicate records, and identify and resolve any null values to avoid bias in the analysis.
- Exploratory Data Analysis (EDA):
- Perform descriptive statistics to get a summary of key features and characteristics of the dataset.
- Visualize the correlation between various attributes to understand their relationships.
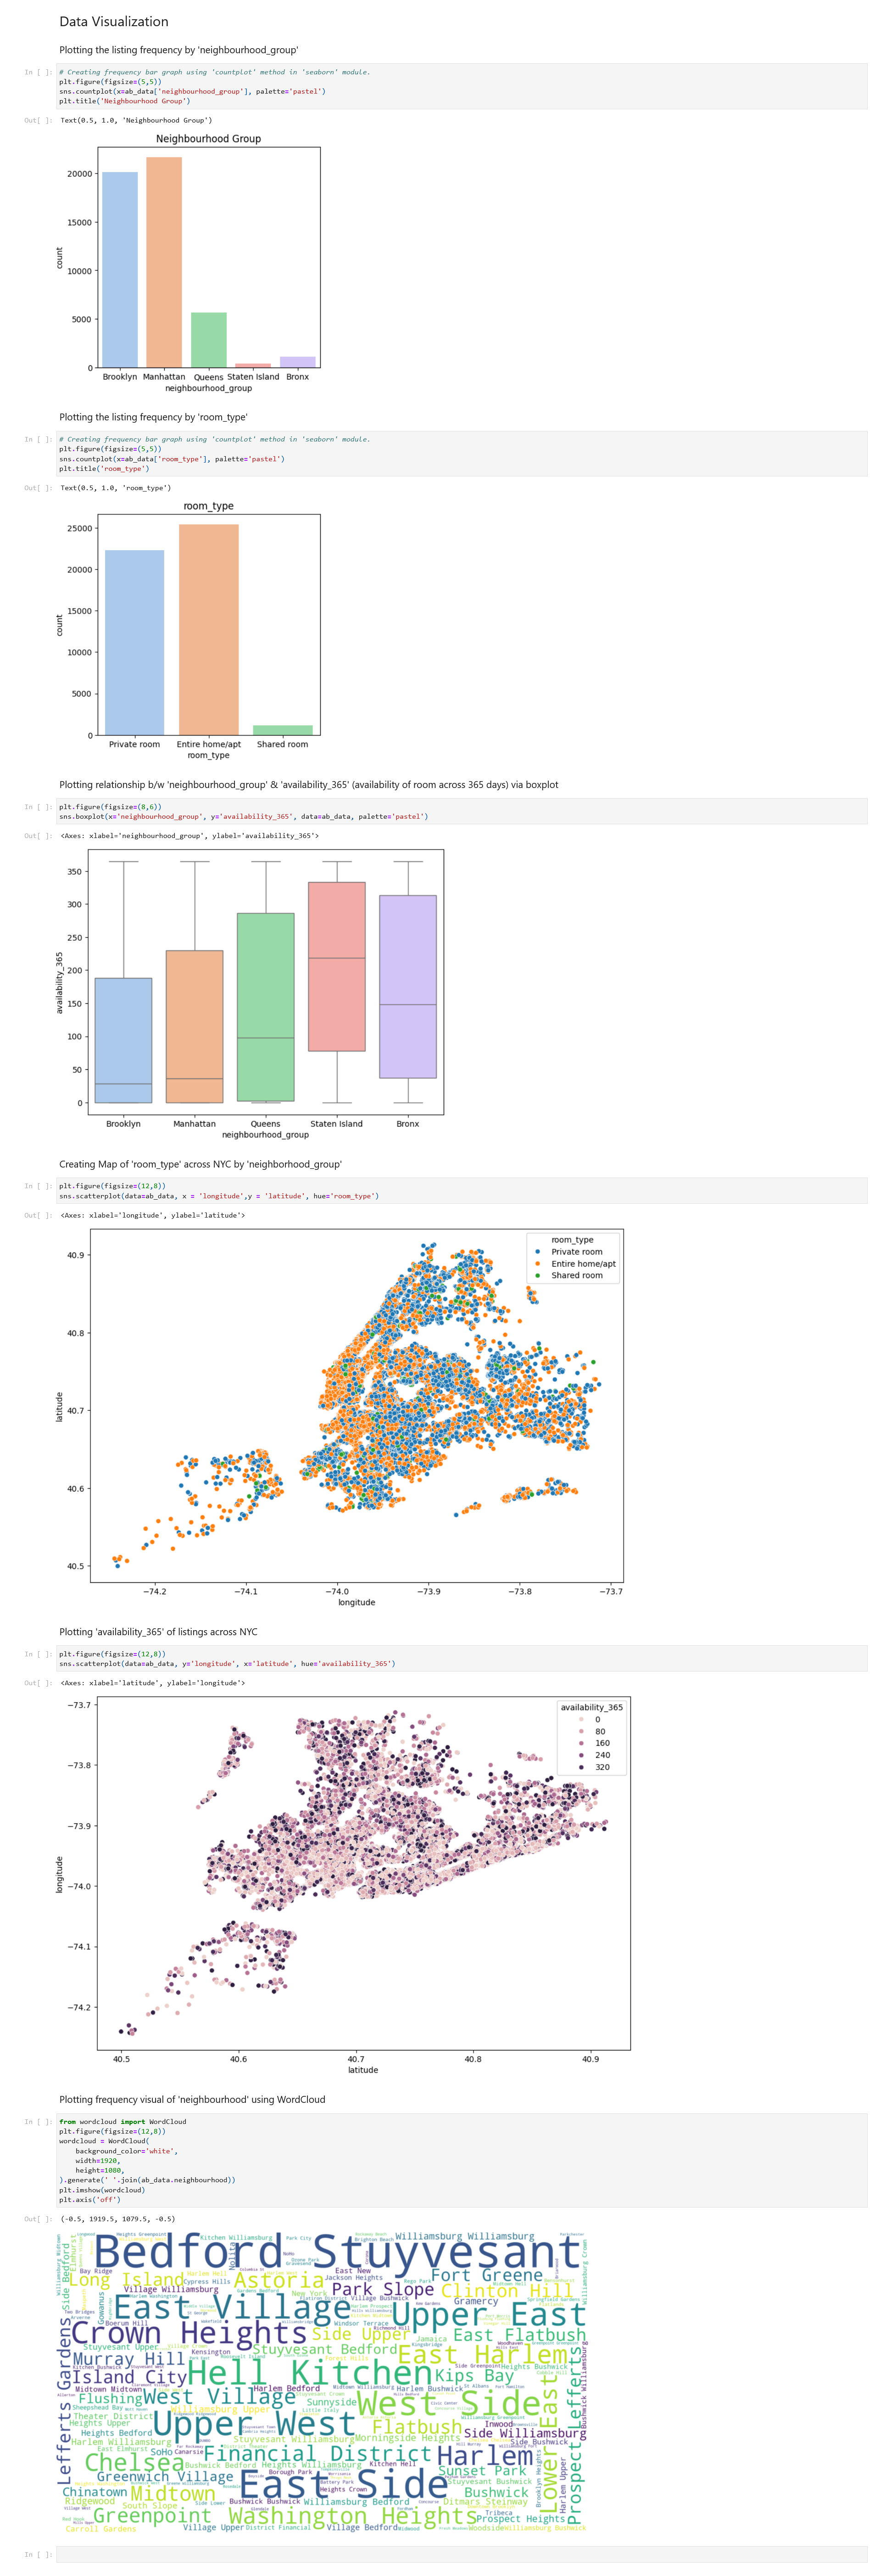
- Explore the distribution of properties across different neighborhoods and room types.
- Visualize the availability of properties throughout the year.
- Geospatial Analysis:
- Plot the geographical locations of properties on a map to visualize their distribution across neighborhoods.
- Analyze the relationship between location and pricing or availability.
- Word Cloud Visualization:
- Create a word cloud of neighbourhood names to visualize their prominence and popularity.
- Feature Encoding:
- Encode categorical features like ‘neighbourhood_group’, ‘neighbourhood’ and ‘room_type’ for usage in machine learning models.
- Price Prediction using Regression Models:
- Prepare the data for the regression model by splitting it into training and testing sets.
- Utilize linear regression, decision tree and random forest regression to predict property prices based on selected features.
- Evaluate the performance of the regression models using the R-squared (R2) score and Mean Absolute Error (MAE).
Code
Section 1: Importing Modules
We’ll import the libraries important for all the tasks required for this project. If any module is not installed, try installing it with the following command: ‘pip install <module name>‘.

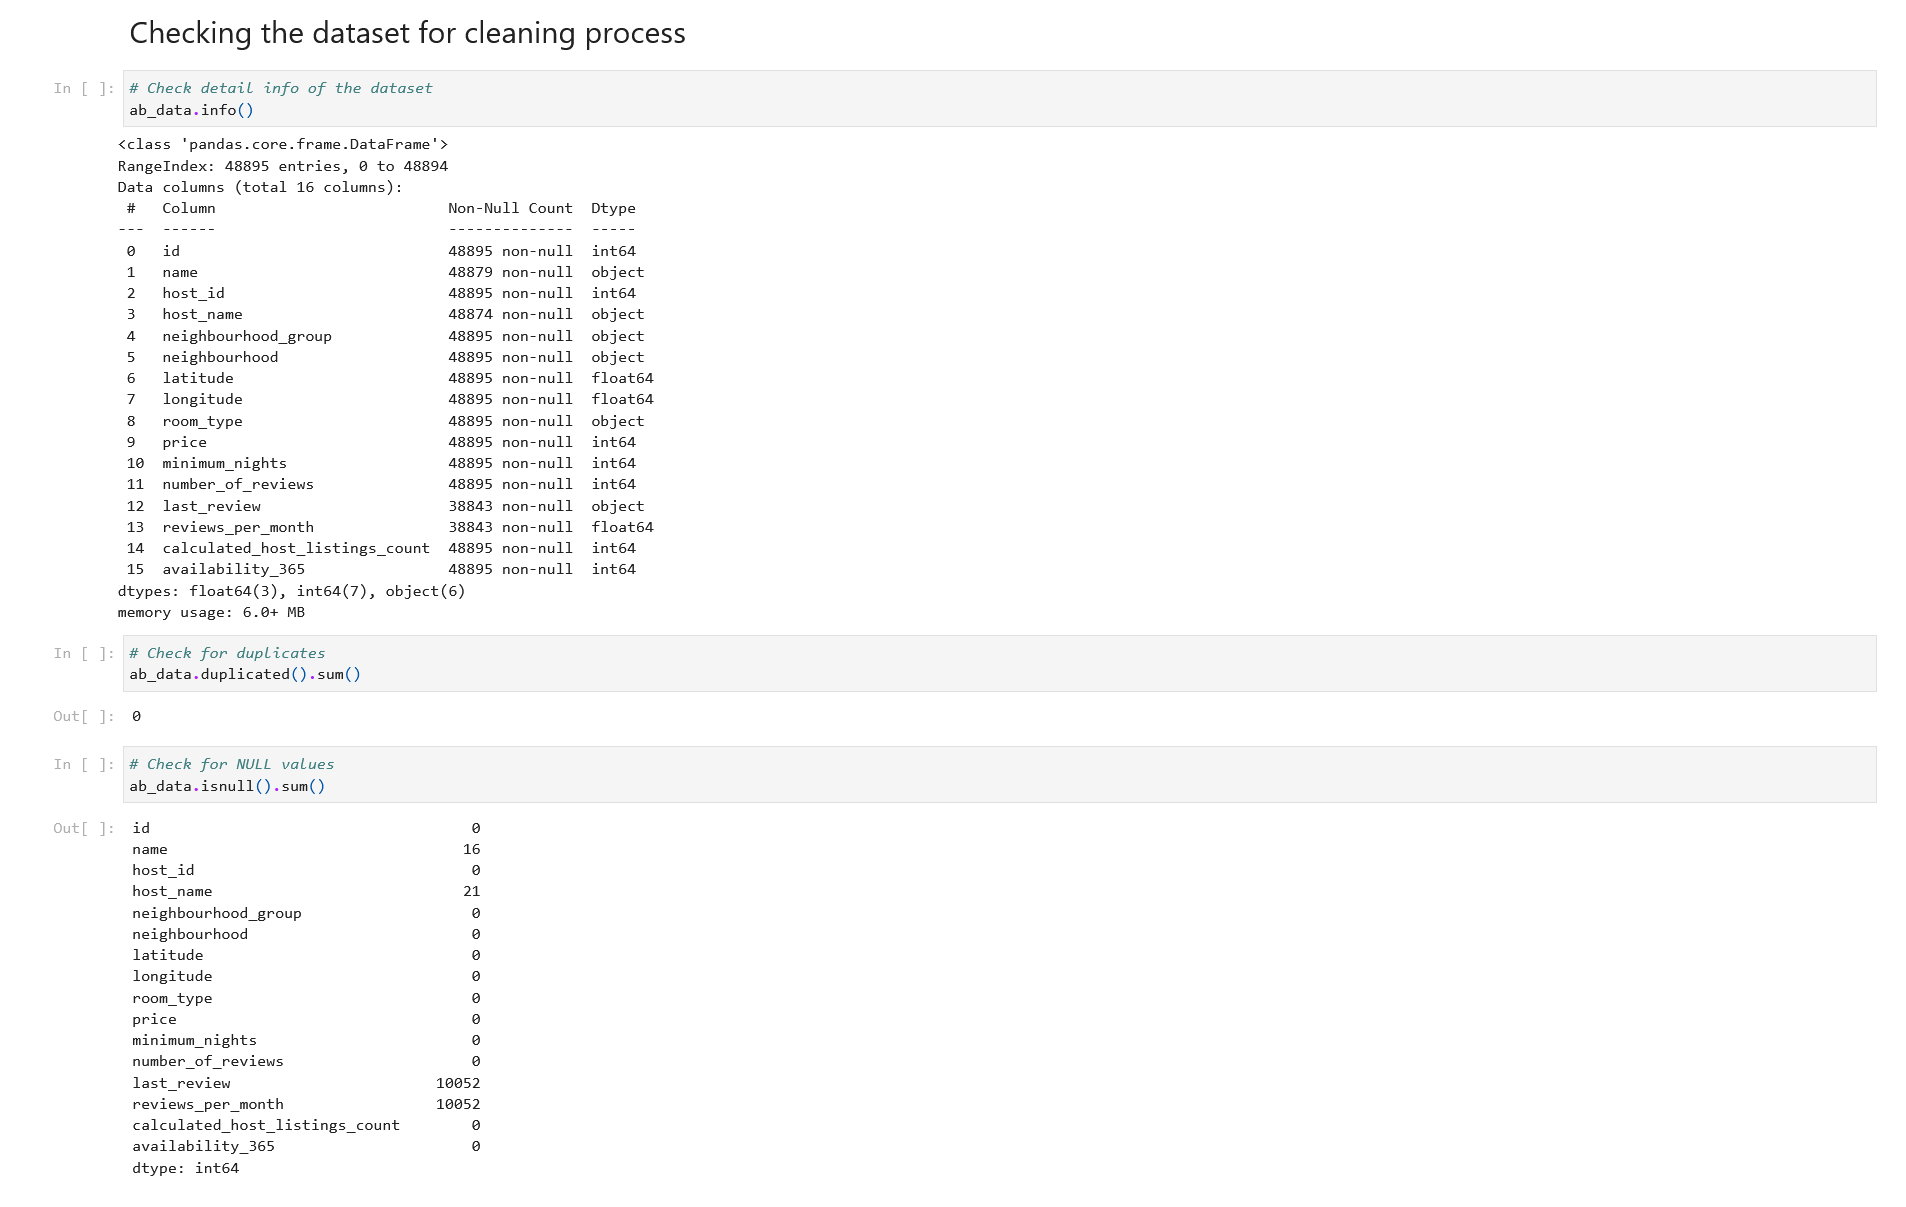
Section 2: Checking dataset for Cleaning Process
In this section, we’ll check the data for issues such as duplicates, null values and detailed data info to understand the structure of data.
Section 3: Data Cleaning
Section 4: Exploratory Data Analysis via Visualization
In this section, we’ll analyze the data visually to understand the structure and distribution.
Section 5: Regression Analysis
In this section we’ll use Linear Regression and Decision Tree Regression models to predict ‘Price‘ based on various factors. Before we jump into Regression models, we’ll need to do a little more massaging to the data.
Dropping unnecessary columns
We’ll drop both ‘number_of_reviews‘ and ‘reviews_per_month‘ columns as these absolute numbers do not decide the price of a particular property. However, if we have the details about the reviews such positive or negative reviews, keywords of each review, etc., we can include them as many people book properties based on what reviews have to tell about the property and the owner.

Encoding the categorical columns
Next we’ll encode categorical columns into numeric ones. Before encoding, always make sure that the data in question is well shuffeld and not in order (alphabetically or numerically). This will impact the predictive model that is being built based on this data. This data is not in order and hence, no shuffling is required.

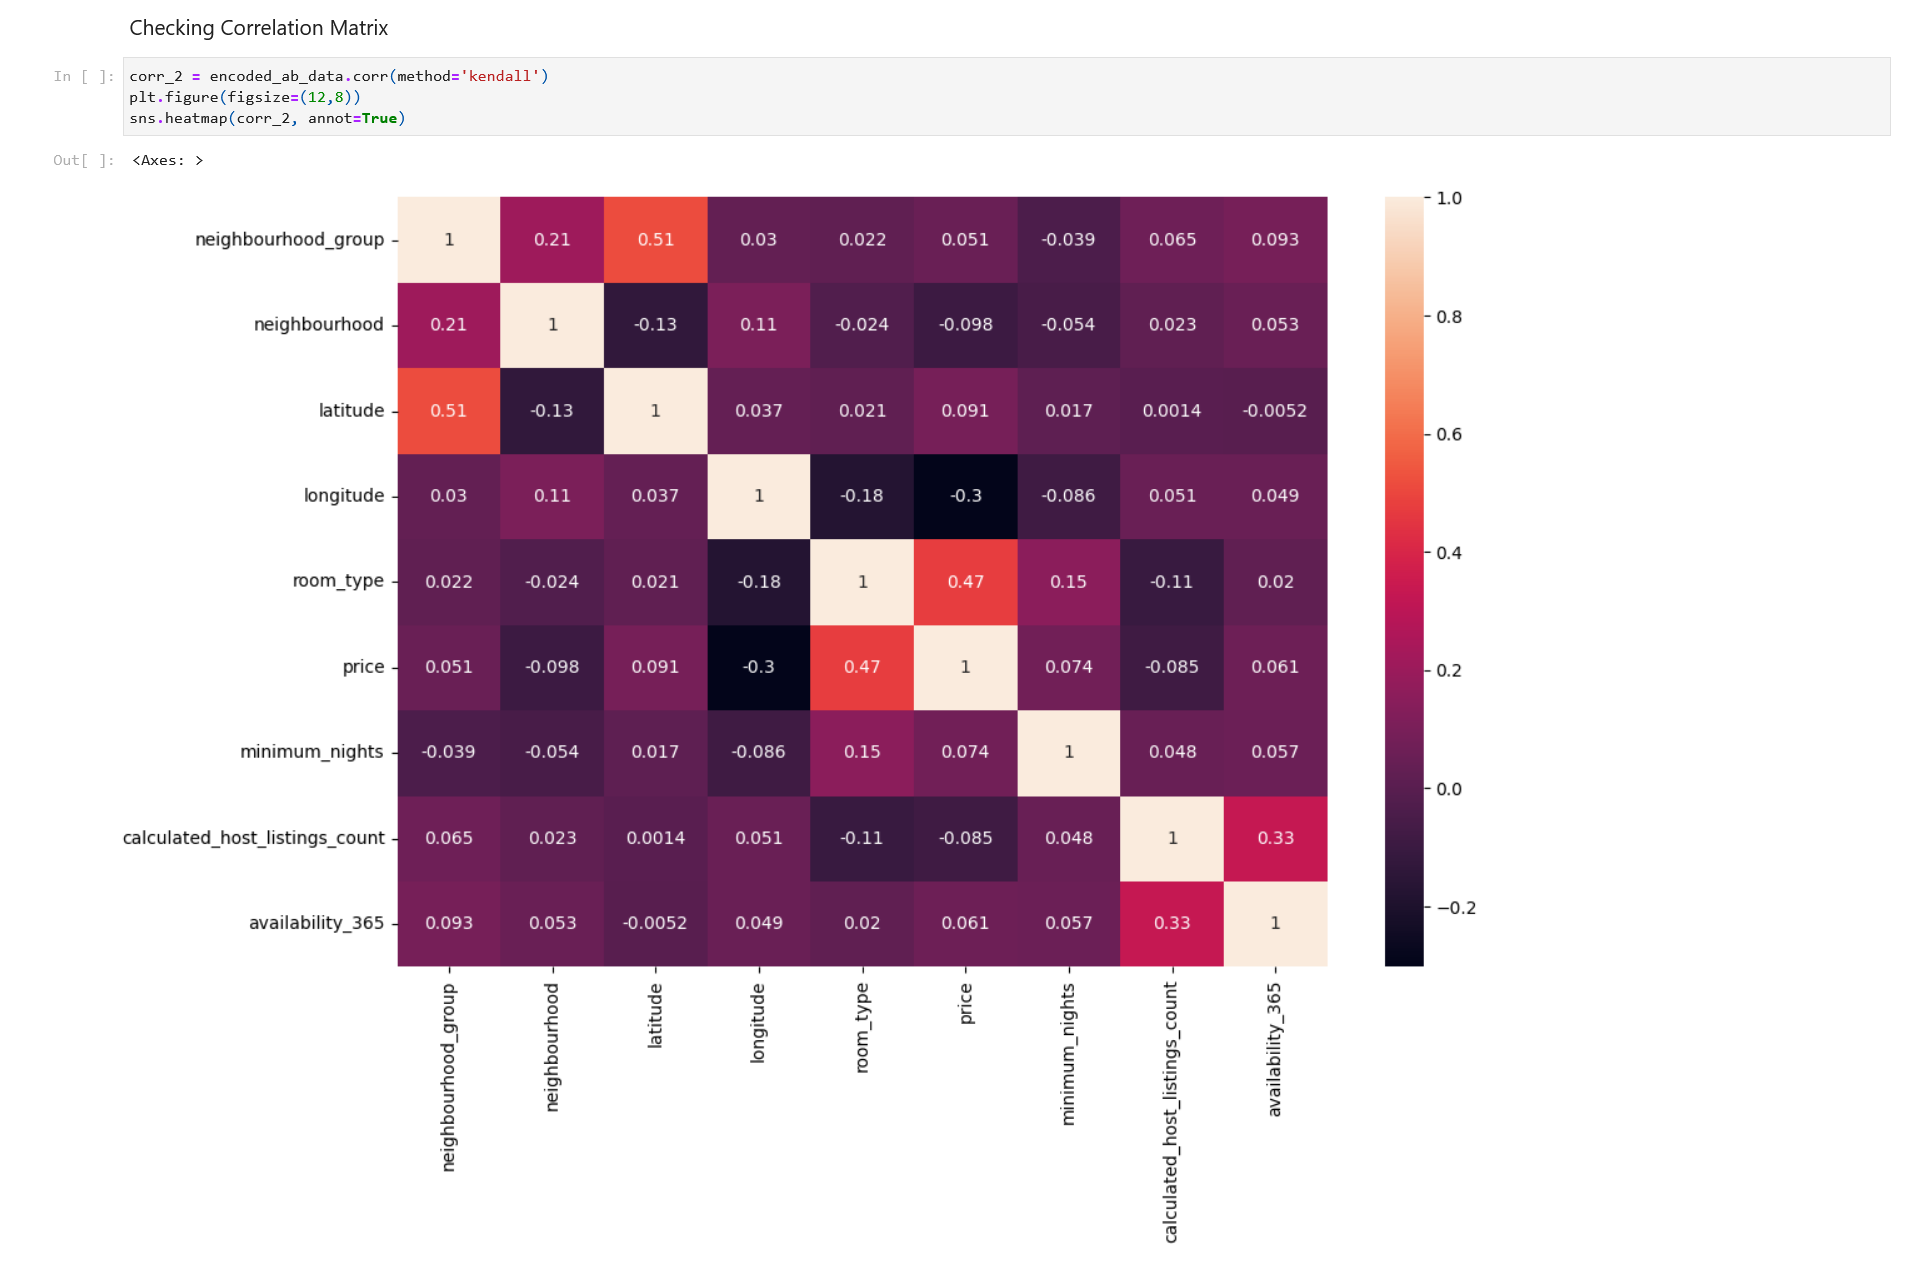
Checking Correlation Matrix
We’ll use ‘Kendall Correlation’ here again.
1. Linear Regression Model
First, we’ll go with Linear Regression Model. Not jumping into mechanics of LR model, it is the most basic of predictive models and most suitable for Linear data. Let’s look at the pairplot of the data in relation to our target or dependent variable, ‘Price‘:

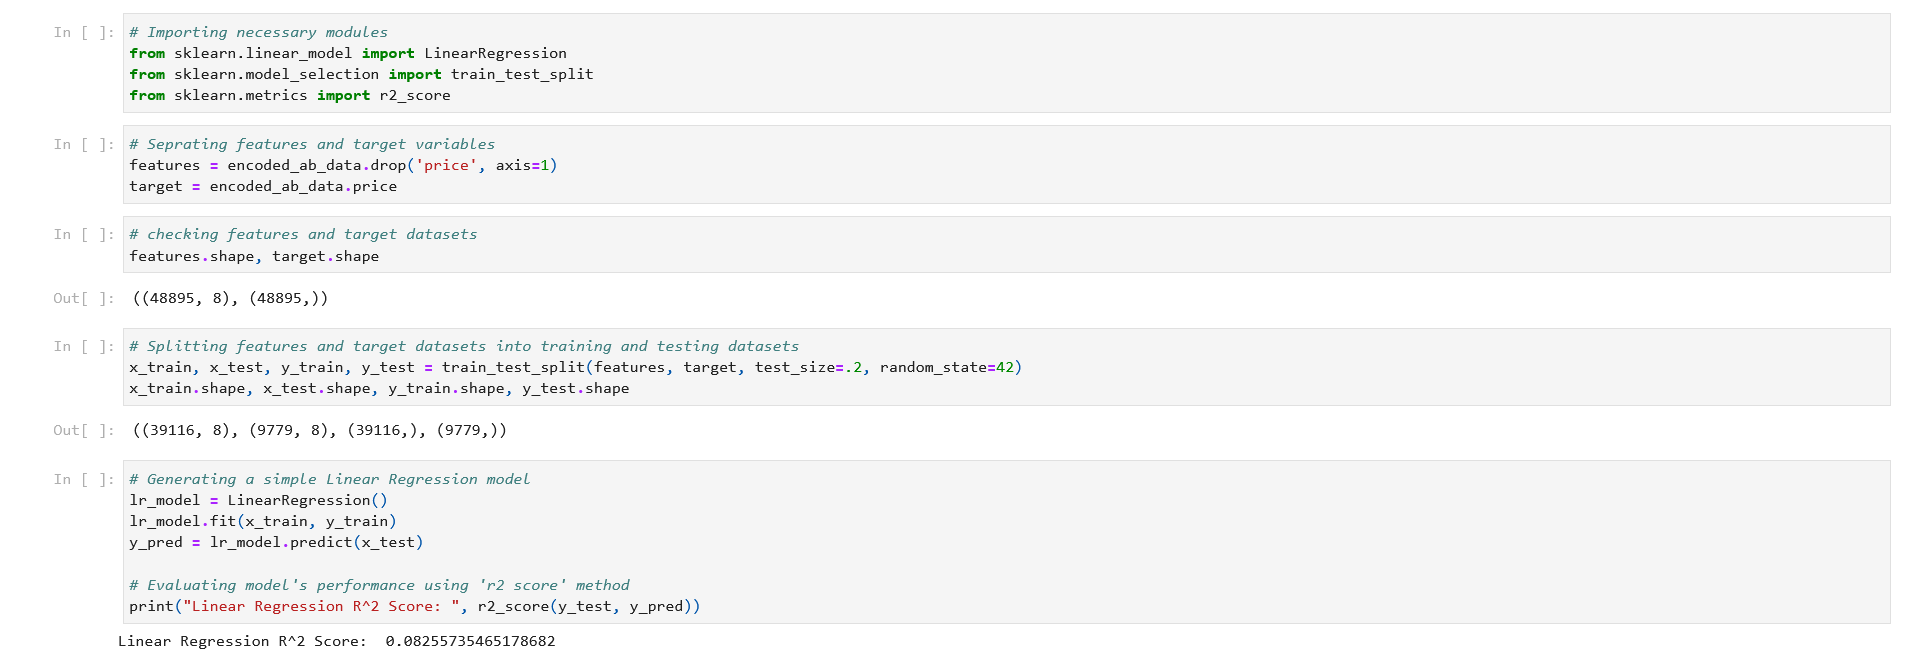
Looking at this pariplot, we can observe that there is very small amount of linearity of variables/features in relation to target, ‘price‘ . Hence, Linear Regression model is not suitable here. However, let’s see how accurately this model makes prediction from this kind of data.
We’ll evaluate the result with R2 (R-Squared) Score.
2. Decision Tree
A decision tree is a non-parametric supervised learning algorithm, which has a hierarchical, tree structure, which consists of a root node, branches, internal nodes and leaf nodes. We’re not going to tune hyperparameters at this point. We’ll do that in ML projects.

3. Random Forest Regression
Random forest regression is a supervised learning algorithm and bagging technique that uses an ensemble learning method for regression in machine learning. The trees in random forests run in parallel, meaning there is no interaction between these trees while building the trees. The results from these multiple trees are then averaged and combine result is returned. Again, we’re not going to tune hyperparameters in this project to keep it simple.

Evaluating Models using MAE
We’ll evaluate above models’ robustness in predicting prices using metric MAE (Mean Absolute Error). The MAE value itself indicates the average absolute error between predicted and actual values. The smaller the MAE, the better the model’s predictions align with the actual data. An MAE of 0 would mean a perfect prediction, but in most cases, achieving such perfection is unlikely.

Conclusion
MAE and R-Squared scores of all 3 models indicates that Random Forest model has performed best for this type of data followed by Linear Regression, surprisingly. We can, ofcourse, tune the hyperparameters of these models to ascertain better prediction power.
Since we have used default tuning in these models, the speed of these models in understanding the pattern has been faster. Although, Random Forest has performed better, but it took much larger time (42+ seconds) than the Linear Regression (almost 0.01 second). The difference of MAE scores aren’t that huge (73.6 for LR – 64.4 for RF = 9.2 difference). So depending on the data and resources at hand including the deployment platform, we have to decide which one we can use.
If the data is small to medium, and limitation of resources exist, better to go with Linear Regression for such data. If resources are unlimited or at least exist in significant amount, better to go with Random Forest with no consideration of amount of data.
Choose wisely!
